Why a land firm built its own parcel search instead of licensing one.
Counties on one map
Pulled live from public GIS
From signing to all counties live
First demo 7 days after scoping
Scoring profiles by dimensions
Weighted by the firm’s own numbers
- Industry
- Land development
- Build
- Custom web platform
- Coverage
- 7 counties
- Built with
- Claude Code, Next.js, Supabase, Vercel
The challenge
The data was public. Using it was not.
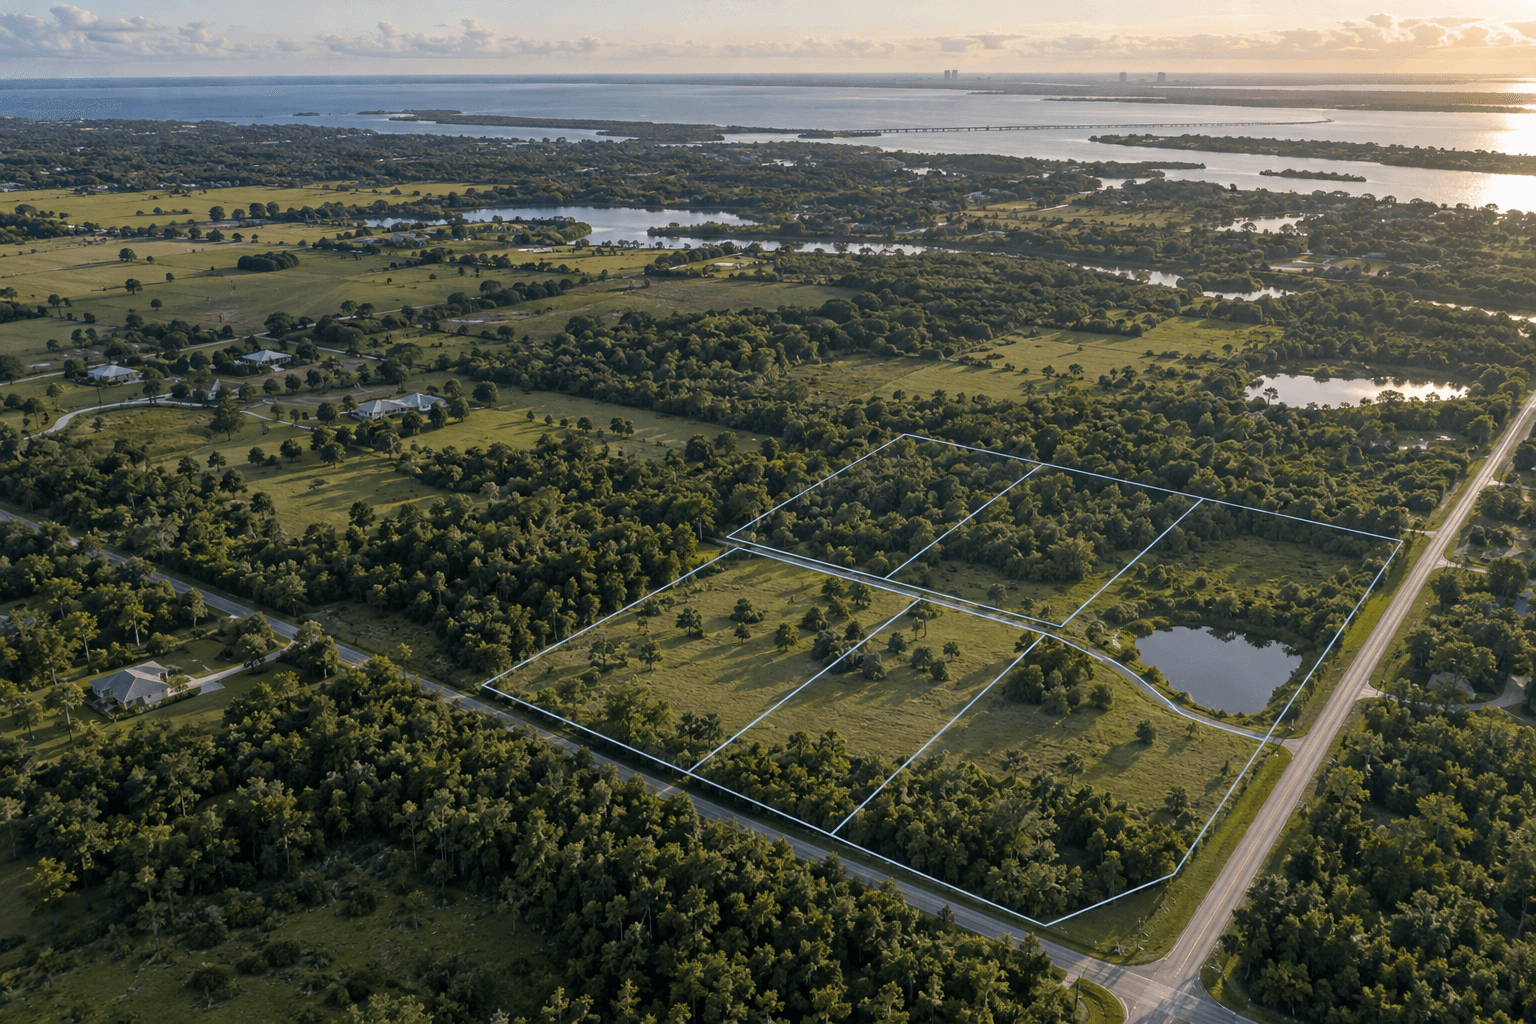
County GIS systems publish parcels, zoning, flood zones, soils, easements, and ownership. The problem is that every county publishes them separately, with different field names, different layers, and different gaps. Evaluating a site meant opening one county's map viewer, then another, cross-referencing records, and measuring boundaries by hand. The firm had already looked at a commercial land-data product. It wanted something it owned and could tune to its own criteria.
Our approach
One county first, then the firm’s own scoring.
We started with one county and the firm's literal brief: press a button, get a list of parcels between 5 and 100 acres. Seven days after the scoping call we demoed a working map.
The firm's operations lead sent back a page of edits: take size and zoning out of the score because they are filters, add a utilities dimension, and split environmental into streams, flood-prone soils, and flood hazard. Then the founder sent the weights. We built both of his profiles exactly as written. Major subdivisions weight environmental constraints heaviest. Minor subdivisions weight parcel shape heaviest. Where a county does not publish a data layer, the score redistributes that weight instead of guessing in the parcel's favor.
What broke
Public data has gaps. We labeled them.
The firm asked for eight counties. One sits behind a firewall, so we shipped seven. Another took its parcel service offline mid-project, and we moved it to the state's parcel feed, which carries less detail. Four counties do not publish road centerlines, so road frontage there is an estimate, marked with "≈" on screen. The firm also caught a measurement bug: one parcel's longest boundary read 334 feet when the county's own viewer showed about 1,736. We were measuring a single segment instead of the full straight run. We fixed it, and the firm got a new filter on that measurement out of it.
How it came together
From a one-county demo to seven counties in production.
One county firstMarch 2026
Parcels, zoning, flood, soils, easements, and septic from public GIS, on one map. Demoed 7 days after scoping.
The firm’s scoring, not oursApril 2026
Two profiles and five sub-factors, with weights supplied by the founder. The first county went into production 18 days after signing.
Seven countiesMay 2026
A per-county registry maps each county’s field names and layers to one model, so filters and reports work the same everywhere.
Signed in and exportableJune 2026
Sign-in, saved searches and saved parcels, one-parcel PDF reports, and bulk CSV export of up to 1,000 parcels.
The outcome
A parcel search the firm owns and tunes itself.
Before
- Clicking through county GIS portals one by one
- Cross-referencing records by hand
- Measuring boundaries by hand in each county’s viewer
- Evaluating parcels one at a time
After
- 7-county parcel map on live public GIS
- Dual-profile development scoring (major and minor subdivision)
- Road frontage and longest-boundary measurement
- Owner, sale, deed, and assessed-value detail per parcel
- Saved searches, sign-in, PDF reports, and CSV export
Have data worth mining?
If your edge is buried in public records, spreadsheets, or scattered systems, we build the tool that surfaces it, around how you actually work.
Start the conversation